Three posts in, spine-gpu draws 8,000 animated Spine characters in 6.7 ms per frame. The upload shrank from 2,160 to 680 bytes per character (post 2), and 144,000 draw commands became one (post 3). Each change made the render thread or the GPU much faster, and each moved the frame time by 2 to 3%. The reason was always the same: the main thread. This post looks at what the main thread actually does, why that’s where the frame time goes, and which of the Spine features spine-gpu still lacks would make it worse.
All numbers are from the same machine as before (Ryzen 9 9950X3D with 16 cores, RTX 5080, Vulkan, 1920×1080) and the scene from post 1: Ella, 27 bones and 18 slots, playing a random animation at a random phase. spine-gpu runs on Bevy 0.14. The code is in bevy-spine-gpu, the benchmark in bevy-spine-gpu-benchmark.
The frame is the main thread
Bevy runs three things in parallel: the main thread updates the game state for frame n, the render thread prepares frame n − 1, and the GPU draws. The slowest of the three sets the frame time.
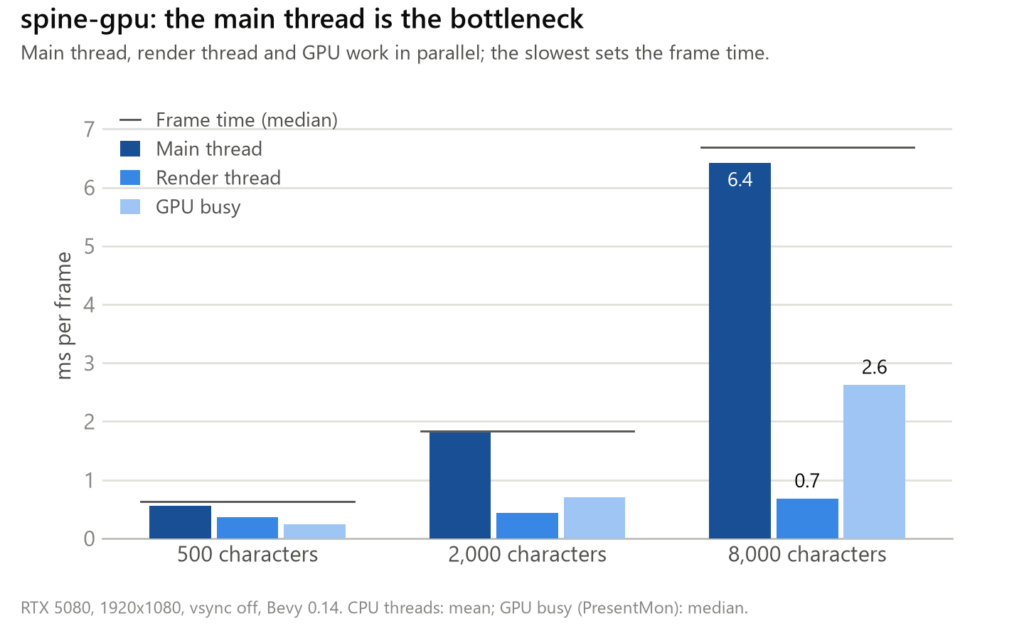
At 8,000 characters the main thread needs 6.4 ms of the 6.7 ms frame. The render thread needs 0.7 ms and the GPU 2.6 ms. Both mostly wait.
That’s Amdahl’s law: speeding up a part of the work helps only as much as that part contributes. The render thread and the GPU didn’t contribute to the frame time, so making them faster didn’t help it. It works the other way too: if the main thread took no time at all, the frame would take 2.6 ms, set by the GPU. That’s the most there is to win on the main thread at 8,000 characters: a factor of about 2.5.
One system
To see what the main thread does, I built the benchmark with Bevy’s trace_chrome feature, which records a span for every system in every frame. Tracing costs about 6% here, so the numbers are a little higher than in the benchmark.
Of 6.8 ms on the main thread per frame:
advance_animations: 6.2 ms, 91%- extracting the frame’s data for the render thread: 0.25 ms
- everything else, including Bevy’s transform propagation: under 0.1 ms each
Almost everything is one system, and that system is a loop over all characters. Bevy can run different systems on different cores, but this one runs on one core while the other 15 have nothing to do.
Inside the loop
For each character, advance_animations advances the playback time and checks whether the character is on screen. If it is, it computes the pose: for every bone, sample the animation’s timelines at the current time, combine the result with the bone’s setup pose, and multiply it onto the parent’s transform. Then it works out which attachments are visible.
A system-level trace can’t see inside a loop, and spans per character would cost more than what they measure. So I used a sampling profiler: Nsight Systems interrupted the process 4,000 times per second for 6 seconds and recorded the call stack each time. Nsight didn’t resolve the function names of the benchmark itself, so I symbolized the samples with Windows’ dbghelp and the debug info, including the functions the compiler had inlined. With link-time optimization, that’s nearly all of them.

The actual math, interpolating between keys and combining the result with the setup pose, is under a quarter of it. The hierarchy walk and the attachments take another quarter. I can’t split that quarter further, because the compiler left no line information for it.
Half of the time goes to finding data.
Finding the current key: 27%. A timeline is a list of keys, and every frame each timeline has to find the two keys around the current time:
pub(crate) fn at(&self, time: f32) -> Option<[f32; N]> {
    let right = self.keys.partition_point(|key| key.time <= time);
    // ... interpolate between keys[right - 1] and keys[right]
}
That’s a binary search, and binary search is fast. But these timelines are short. The idle animations rotate 8 of Ella’s 27 bones, with 3 keys each; the walk animations rotate 24 bones, with about 4 keys each. A search over 4 keys isn’t deep, but it is a call and a few branches that depend on the data and are hard to predict. It runs for every timeline of every bone of every visible character, every frame. And from one frame to the next, the answer almost never changes: time moves forward by 7 ms, and the key is usually the same as last frame.
HashMap lookups: 24%. The timelines of an animation are stored by bone, in a HashMap:
let timelines = animation.and_then(|a| a.bone_timelines.get(&BoneIndex(i as u32)));The same goes for the slot timelines, and for the map from entity to a character’s instance data. The keys are small integers: bone 0 to 26, slot 0 to 17. But Rust’s standard HashMap hashes them with SipHash, which is built to resist hash-flooding attacks from untrusted input. For a lookup by bone index, that’s a lot of work: about 50 lookups per character per frame, 400,000 per frame at 8,000 characters.
Culling, on the other hand, costs almost nothing: playback and the visibility check for all 8,000 characters are 2% of the loop.
What would help
The profile points at three changes, none of them tried yet:
- Index instead of hash. Bone and slot indices are dense, so the timelines could live in a
Vecindexed by bone. That removes most of the 24%. - Remember the key. Each character could keep the key index per timeline from the last frame and start there. Usually that’s the right key, and checking it is one comparison.
- Use the other 15 cores. Characters don’t depend on each other, so the loop could run in parallel, with Bevy’s
par_iter_mut. Even on all 16 cores, though, Amdahl’s law sets the limit: the frame can’t get faster than the 2.6 ms of the GPU.
The first two make the work smaller, the third spreads it out. They combine. But before any of them, there’s a different question: what happens to this loop as spine-gpu supports more of Spine?
Is it fast because it does less?
That’s the question from post 1, and the profile helps answer it. spine-gpu lacks features the other renderers have: constraints, deform timelines, clipping, blend modes and more. The full table is in the repository. The benchmark animations use none of them, so the comparison in post 1 is fair. But how much would they cost if spine-gpu supported them?
It depends on where a feature does its work.
Features that only change bone transforms fit the architecture. IK, transform and physics constraints, shear and inherit modes only change how the bone transforms are computed. They’d add work to this loop, per bone, but not a single byte per vertex, and the GPU wouldn’t notice. A rig has far fewer bones than vertices, so this is the cheap place for work to be.
There’s one measurement for this. Ella’s animations use only linear curves, so I made a copy of the rig with a bezier curve on every key, which spine-gpu supports. In a sweep before the changes of post 2, at 8,000 characters, the main thread went from 6.45 to 6.86 ms (+6.5%), and the GPU time didn’t change at all. For the other three renderers, the same change disappeared in the noise of a 15 to 120 times longer frame. Features that only change bones cost spine-gpu a little CPU time per bone, and in a small frame, it shows.
Features that change vertices are in tension with it. Deform timelines move individual vertices per character, and clipping cuts the mesh per character. Both need per-character vertex data every frame, which is exactly what post 2 got rid of. Blend modes don’t change vertices, but they need a different pipeline per slot, which splits the one instanced draw per skeleton type into many, like the sorted runs in post 3. Draw order timelines change the order of the slots per character, while spine-gpu bakes that order into the index buffer of the skeleton type. For each of these there are workarounds (a few precomputed slot orders, a separate path for the characters that need deform), but none of them comes for free.
So “fast because it does less” is half true. The features it lacks that only touch bones would cost some CPU time, in the loop that this post profiled. The ones that touch vertices are the reason the other renderers do what they do.
Summary
- spine-gpu’s frame time at 8,000 characters is its main thread: 6.4 of 6.7 ms. The render thread and the GPU wait.
- 91% of the main thread is one system, a single loop over all characters on one of 16 cores.
- Within that loop, half the time goes to finding data: a binary search for the current key in timelines of 3 to 5 keys (27%), and SipHash lookups by bone and slot index (24%). Computing the pose is the smaller part.
- Index instead of hash, remembering the last key, and running in parallel all point at the same loop. The GPU sets the floor at 2.6 ms.
- Features that only change bones fit the architecture and cost CPU time per bone (bezier curves: +6.5%). Features that change vertices don’t fit and would need a different path.
That’s the end of the series. The time that the usual approach spends rebuilding meshes and creating thousands of buffers per frame is gone, and so are 144,000 draw commands the GPU didn’t need. What’s left is one loop on the CPU, and the profile says how to make it shorter and parallel.